
Artemis is a data platform that tracks blockchain metrics and stablecoin flows through a terminal and spreadsheet plugins for investment research.
About Artemis
What is Artemis?
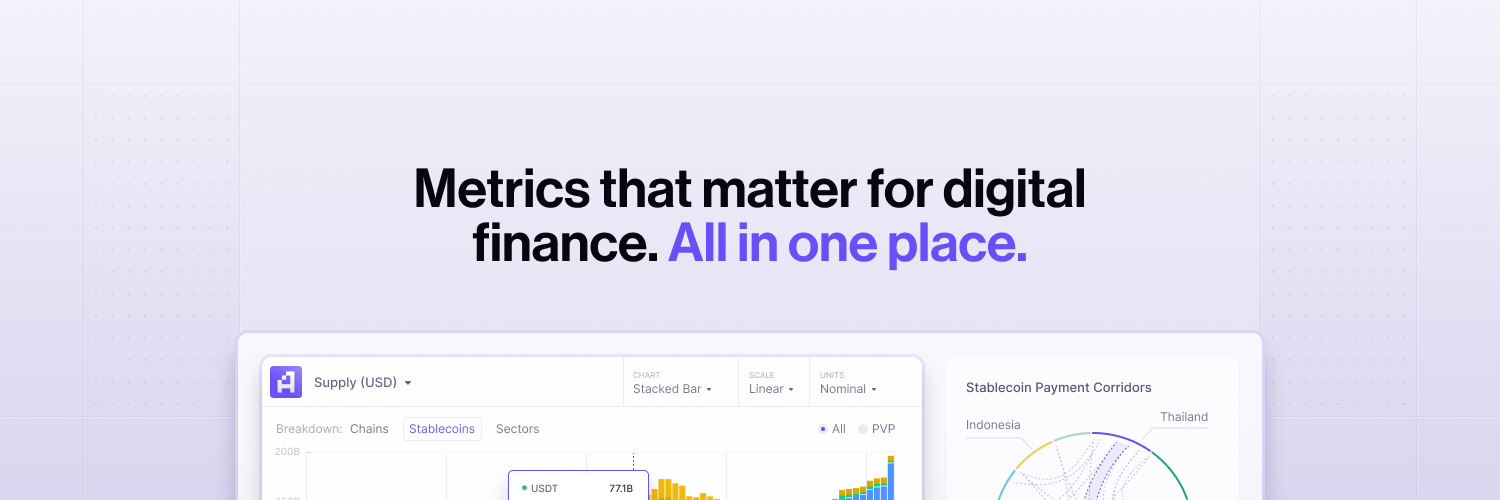
Artemis is a data platform for analysts to track metrics across blockchain networks and stablecoins. It has a terminal for protocol level data and plugins for Excel and Google Sheets. The tool provides information on active addresses, transaction counts, and developer activity. It is a resource for firms like Visa and McKinsey to monitor trends in crypto and fintech.
The platform tracks stablecoin flows and bridge volume to help users evaluate market liquidity. It has charts that compare the performance of different chains. Analysts use these data points to build models and verify on-chain events. The system is a bridge between raw blockchain data and investment research.
Key Features
Pros & Cons
-
Unified institutional dataThe dashboard aggregates on-chain metrics across major networks for analysts at firms like Visa and Grayscale.
-
Direct sector comparisonsUsers evaluate performance trends between stablecoins and AI tokens through a single interface.
-
Excel and Google Sheets pluginsRaw data flows into local spreadsheets through official integrations for custom modeling.
-
Limited free accessMany advanced metrics and historical data views are restricted to users with a paid enterprise license.
-
Technical setup requirementsAnalysts need experience with spreadsheet formulas and API configurations to make use of the external plugins.
-
Narrow asset focusData coverage excludes smaller altcoins and emerging protocols outside of the specific established sectors listed in the directory.